The past few years, we were constantly in contact with people like you. Tour operators and activity providers have become our most fabulous friends. As we were building kleesto, your problems, desires, and main concerns were our guiding lines. One of the most frequent themes of discussion with tour operators over the years was business data analysis.
We know that the process of measuring your growth is a complex and time-consuming task. Mistakes can quickly happen, and it seems like every company is struggling with analyzing its performance. That’s why we designed Kleesto.
We measure everything. You get results
To show you what we mean by that, think about the following questions:
Which ones of my sales channels are providing the most outstanding value?
What percentage of my tours are coming from each channel?
Which one of my activities is the most popular?
How many tours did Ι book during the past six months?
What’s the average number of tickets per booking?
We took into consideration all your thoughts and questions and designed our business analytics feature based on them. Kleesto will give answers to all these questions. Our business analytics system encompasses various business intelligence tools which provide a clear visual overview of your performance.
You are not just getting results. Every number is represented in its most optimal way to be understood.
Clarity is what we offer
We turn your results into valuable insights that help you make better decisions.
Discover how to use Kleesto’s business analytics
By clicking on the “reports” tab on your dashboard, you will find everything related to what’s happening in your travel business.
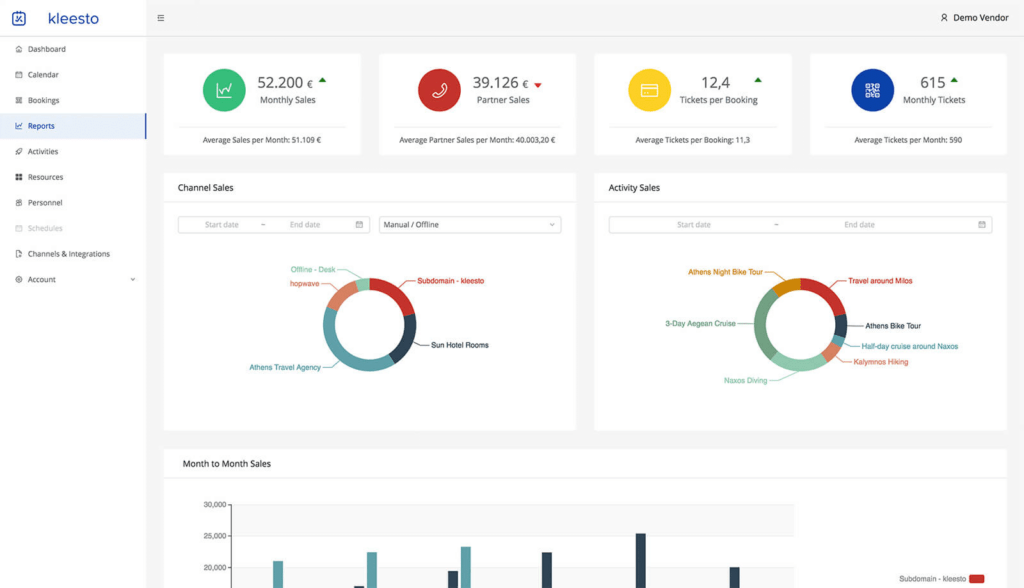
The upper part of your screen informs you about the most critical numbers of your travel company, an overview of what’s happening, and retain control of your business.
You are receiving data about:
– Your Monthly Sales & Average Sales per Month
– Your Partner Sales & Average Partner Sales per Month
– Tickets per Booking
– The number of your Monthly Tickets
But, Kleesto has more to offer. You can further analyze your data. As you can see, you can reach a greater understanding of:
– Your Channel Sales
– Your Activity Sales

- About your channel sales:
Kleesto allows you to examine which channels perform the best in a clean and easy-to-understand way. If you move your mouse pad on your business report’s different colors, the results will be available to you both as a number and as a statistic. Therefore, making comparisons will be a matter of a few seconds.
Furthermore, as you can see, you are free to choose the specific period that you want to analyze. Just fill in the start and end date. - About your activity sales:
You can design the same system for your activities. Identify which one of them is profitable is helpful to understand your overall performance and draw meaningful conclusions.
It is time to amplify your business intelligence and take control of your business!
Business analytics of your channels based on seasonality
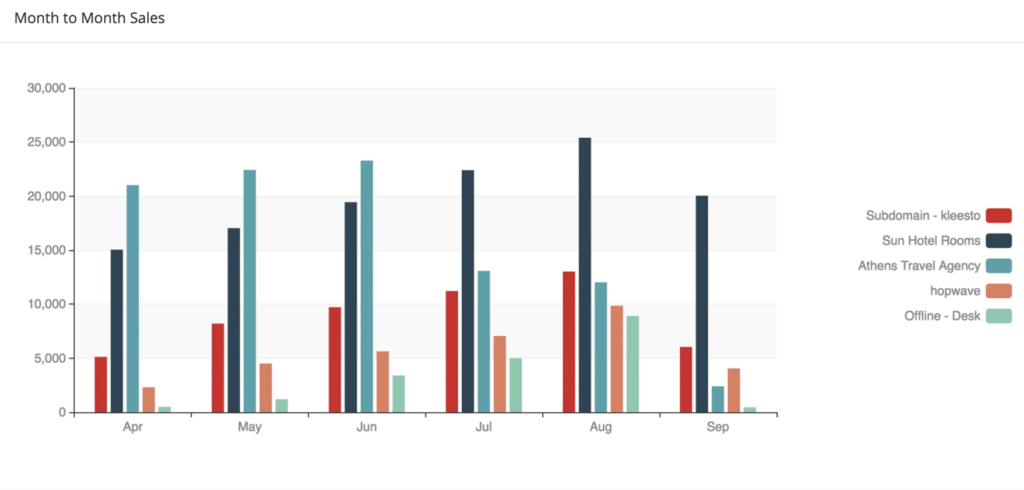
With this image, you can identify patterns of the past.
You can obtain valuable insights on how you will arrange your future strategy
Furthermore, seasonality analysis correlates a lot with tour operators in nature or countries where the climate is harsh. In these cases, the weather is often a reason to cancel a tour or activity, and many times activity providers are thinking of stopping operating off-season completely.
But, without measuring your performance, how can you know if it’s an excellent choice to keep providing these activities?
On the other hand, you can boost your marketing campaigns in these months when your tours and activities are receiving most of their bookings. All you need is a few clever marketing moves.
To illustrate that, some of the best practices that your fellow tour operators favor in similar situations are:
– To offer packages or discounts for raising the potential of their best tours.
– To focus their marketing campaigns on these specific activities (for instance, you can dedicate your whole budget to creating a video promoting this activity or advertise it on your social media)
– To find more tour guides and increase the maximum capacity of these activities.
Why measuring “tickets per booking” is essential
Imagine you provide an activity with a maximum capacity of 16 people, and you just booked two families with five members each. There are only six tickets left. If your average tickets per booking number are 6.84, that means that you will most probably receive requests for 6-7 people in the future. Therefore, if you receive another request for a couple of 2 more guests, you will have four tickets left.
What does that mean?
Your numbers predict that it is highly probable never to have another request with four people or less. As a consequence, four tickets will remain unsold. You will know how many seats you have to fill in both scenarios above, and you may decide to promote them with an offer, for example. With Κleesto, you can also learn everything about your present bookings and make intelligent decisions.
Overview of your current bookings in a snap
Above the “reports” tab, you can click the “bookings”. You will there find how many of them are pending your approval.
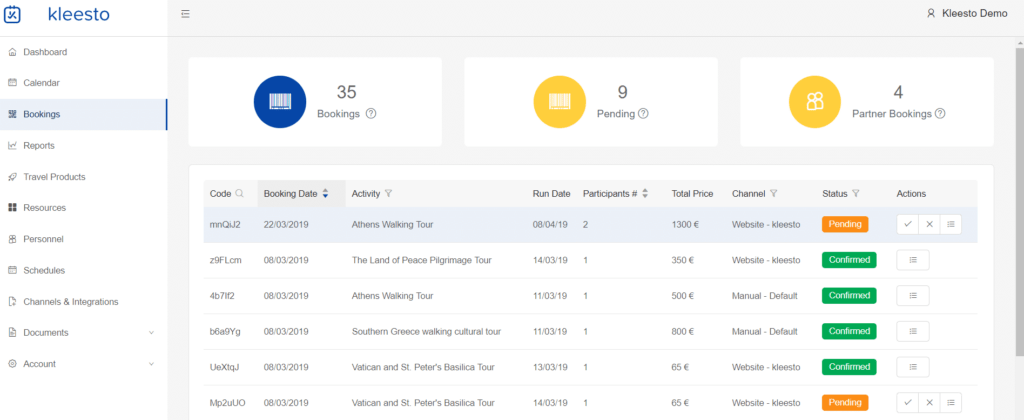
The pending bookings are colored orange. As you might notice, we have used the power of colors extensively to help you make decisions fast and learn how to use Kleesto intuitively.
Conclusion
Every manager can learn how to use Kleesto during a short period. In addition, you can train your best employees to use it and do business successfully! Nothing can stop your company from functioning correctly with kleesto.
Every interaction related to your company is presented on your screen, translated into valuable insights in real-time. I could praise our business analytics feature a lot more, but I like this quote that reminds us of this simple truth.


